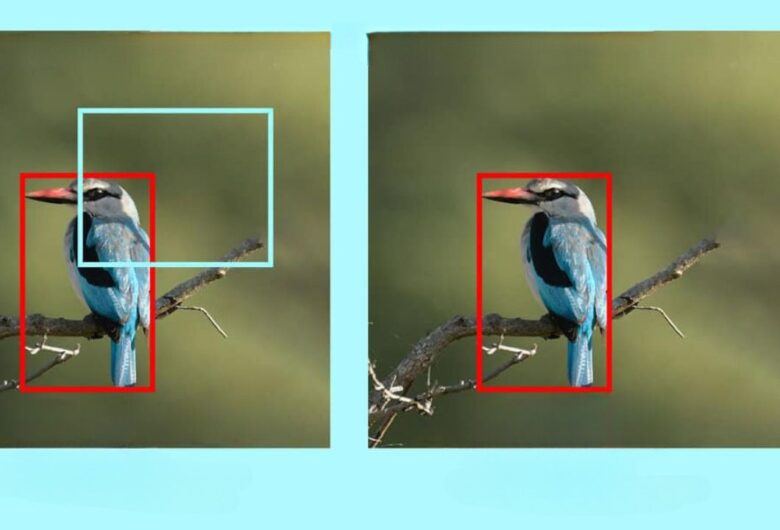
With object detection, machine algorithms can identify and classify objects within digital images and video frames. Thanks to them, we benefit from a myriad of different applications on a daily basis. From face recognition to unlock our mobiles to surveillance systems in public places, the role of computer vision cannot be overstated.
However, the increasing demand for computer vision requires increasing its performance. We make it real by using various techniques. Mean average precision (mAP) is one of such benchmarks that evaluates the accuracy of computer vision performance. MAP provides the advancement of computer vision. It does it by measuring accuracy and comparing with other computer vision models. It allows implementing tangible improvements across various industries.
Let’s see how mAP works and how it helps to leverage the performance of computer vision.
Contents
The Concept of Mean Average Precision (mAP)

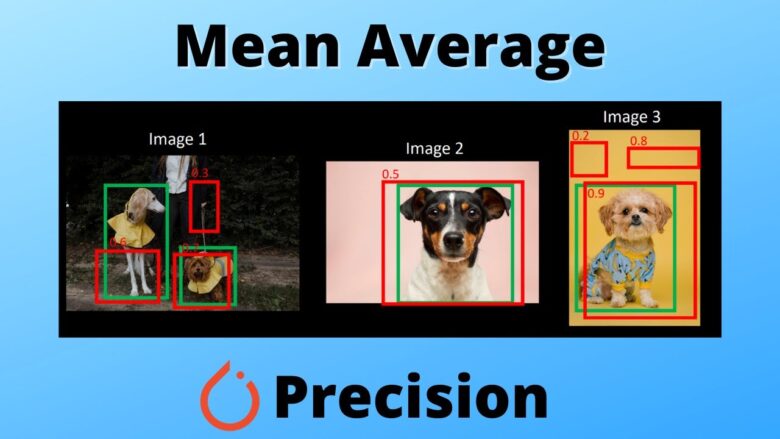
Source: youtube.com
Mean average precision (mAP) is one of the comprehensive metrics used to assess the performance of computer vision models. It is based on the metrics of precision and recall that are reflected in its formula. This metric helps to assess how correctly a computer vision model identifies and classifies objects. It also shows how effectively the model detects objects within one video or image frame on various detection layers.
The Calculation of mAP
The mean average precision object detection is a complex process that consists of numerous steps. The performance of an object detection model takes place across several levels and classes. To calculate the mAP, you should follow these steps:
- Data preparation. The calculation of mean average precision object detection starts with gathering the data. It also includes both ground truth and predictions of the model. It will contain all the labels for the images, bounding boxes, and a confidence score.
- Matching predictions and ground truth. For every image, you will then compare the ground truth metrics with the model’s predicted metrics.
- Calculating precision and recall metrics. These metrics will lie between the metrics of true positives and false positives, true negatives and false negatives. The calculation should be done at all confidence intervals.
- Creating precision-recall curve. The curves for each class will show whether the prediction is placed within true positive or false positive results. It will show how the precision changes across classes.
- Calculating the average precision (AP). You will then calculate the area between precision-recall curves, defining the AP for the class. It will show the model’s performance across various levels of confidence.
- Computing mean average precision (mAP). Finally, you arrive at a single metric that shows you the overall performance of your model. It takes into account its effectiveness across classes.
Benefits of Mean Average Precision for Object Detection

Whether your model works for map object detection or face recognition, the mean average precision object detection brings benefits for model development and deployment. This is a comprehensive evaluation means that helps to find balance between recall and precision metrics. With this metric, you can compare different object detection models and select the best one for your application.
With mAP, you may see where your model can underperform and design the targeted improvements. Calibration and confidence help you with that. This metrics also helps to assess the adaptability of the model across different applications. Besides, with mAP, you can create the generalized models across industries.
Real-Life Examples of mAP Usage Across Industries

Source: spyro-soft.com
MAP enhances models’ performances and points to models’ weaknesses. Consequently, it stands out as a valuable source for improvements. Here are some of the examples how mAP can leverage the performance of the computer vision models across industries:
- Healthcare: Object detection models help to identify anomalies and detect diseases. Some examples include tumors or fractures. To map object detection based on images taken from x-rays or MRIs, we use mean average precision for the model’s better performance. In this case, the mAP helps to minimize missed diagnoses and eliminate unnecessary treatments. With mAP, the diagnoses become more precise.
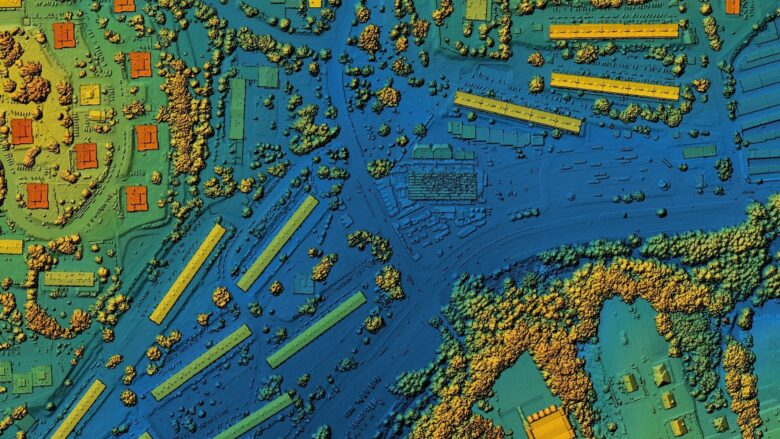
- Geospatial mapping: Mean average precision is used in analysis of satellite imagery. The models are used for object detection maps in determination of roads, buildings, and land changes. With mAP, the mapping becomes more precise. It enhances better urban planning and environment monitoring.
- Automotive industry: Object detection models are the basis of automated vehicle systems. With computer vision algorithms, the vehicles identify pedestrians, moving objects, and traffic lights. With mAP, the performance of such models increases. This contributes to road safety and the development of such vehicles.
- Retail: Retail uses object detection models to track inventory. It is also widespread in stock monitoring and customer behavior analysis. The usage of mAP allows refining object detection models for better performance. With the usage of this metric, computer vision models can detect products more accurately. The company can thus boost its operational efficiency.
- Agriculture: The industry widely uses object detection to monitor crops and prevent anomalies, such as pests or fires. There is need to have targeted interventions, which becomes possible with the usage of mean average precision metric. This metric enhances model performance. As a result, an improved model contributes to improved crop management and reduced environmental impact.
These are only some examples where mAP can leverage the productivity of object detection models. This approach contributes to continuous improvement of the model. By using mAP, we evaluate the accuracy of object detection algorithms, which in the end gives us reliable results.
