

When conducting a presentation in a business environment, it’s imperative to convey the information that you’re sharing in a clear, concise and engaging manner.
Facts and figures need to be precise, well placed, and noticeable – after all, it can make all the difference in winning the approval of a prospective client or partner or losing an invaluable deal or collaboration.
If your presentation revolves around making a pitch, you’ll no doubt be eager to include as much supporting information as possible, but by all means, try to avoid laying out your statistical details in off-putting and distracting text boxes. Instead, look to showcase your points in clear and easy-to-follow charts.
The successful relaying of information in charts can make all the difference in producing a winning presentation, so here’s a list of tips to help you along in impressing those you’re aiming to pitch to both efficiently and strategically.
Contents
Utilize the right chart at the right time
Sometimes data can be so complex that you might need a little bit of help in strategizing how to present it clearly to your audience.
Microsoft Excel can pay dividends in such situations. When you’re looking to draw on figures inside Excel, click the ‘Insert’ tab and select ‘Reccomended Charts.’ Here, the software will take a look at the values under the spotlight and suggest the more appropriate method of charting them all without overcomplicating the visuals or becoming too convoluted.
Recommended Charts offers a series of previews accompanying its visualizations with brief descriptions of each chart or table and what their common purposes include – a helpfully added perk just in case you need a helping hand.
Of course, there are some basic common practices that you can adhere to when picking the type of chart to include in your presentation. Pie charts are excellent when it comes to expressing percentages, while line graphs are ideal for identifying and forecasting trends. Horizontal bar charts are useful for comparing quantities and vertical line graphs are great at showing changes in quantity over time.
Abandon all clutter

In many business presentation scenarios, you’ll likely have long identified the key hooks in your content that you’ll be aiming to snag your audience on.
Essentially, your primary aim is to direct the eyes of all viewers onto the charts and tables that are designed to underline your appeal to them – anything that could be interpreted as obstructing this appeal must be ditched immediately.
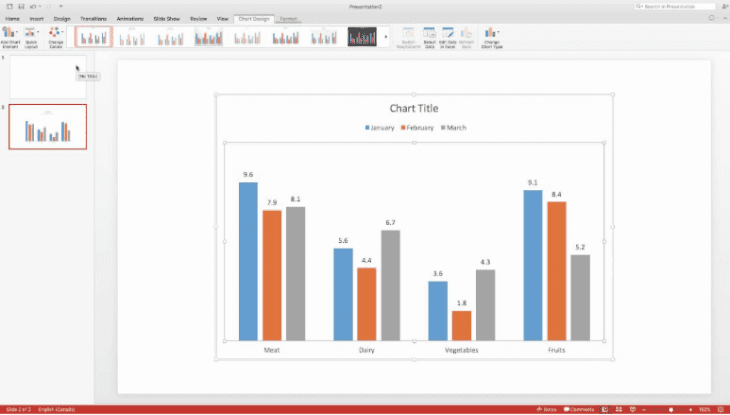
Distracting backgrounds must be removed. So too should contrasting reference lines and annoyingly bold text. It’s also worth considering ditching the X and Y axes of a graph and simply labeling the values directly to better illustrate what you’re trying to say.
The same rules should apply to the wider presentation as a whole. Try to find a consistent theme that doesn’t draw attention away from the content. Luckily, there’s plenty of websites available that showcase downloadable PowerPoint ready-made themes for users to utilize for a range of situations. Simpleslides.co is among the popular sites that can help you find the perfect template for your next presentation.
Provide a clear conclusion
Every chart should tell a story, there wouldn’t be much point in it if not. Make sure your audience will be capable of drawing their conclusions within the time that a slide will be on screen.
The data you’re showcasing should either support what you’re trying to say or at least speak for itself. If this isn’t immediately obvious, then it’s worth supporting your charts with indicative text. For example, the short title ‘Sales across regions’ is functional but vague – if instead, you went with ‘East performs the best in 2018 Q4’, the viewers will immediately know what they’re looking at and draw from the graph data to support your assertion.
Always link data
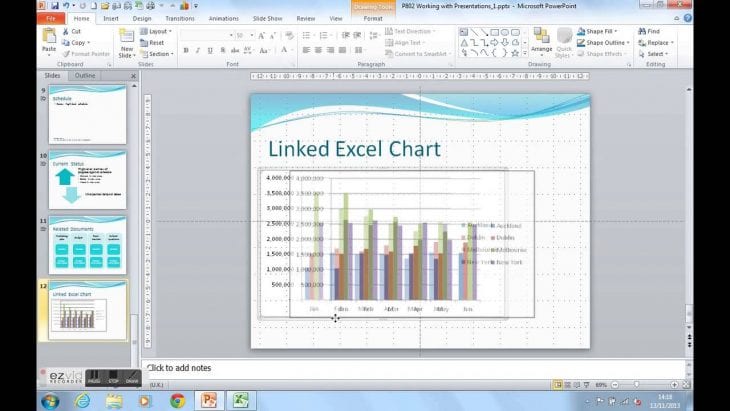
When you copy a chart from Excel and paste in PowerPoint, make sure you link the data to Excel. Select ‘Use Destination theme and link data’ to keep the formatting of the destination or ‘Keep source formatting and link data’ to retain the formatting in the Excel file.
This little measure will ensure that your figures remain up to date as circumstances around the data change. To update the chart with linked data in PowerPoint, right click on the chart and click on ‘Edit data.’
Thanks to maintaining a direct link to the source of your data, you can stay safe in the knowledge that the statistics you’re providing paint a clear picture of the point you’re trying to make – just remember to take a moment to check the updated data before setting your conclusions.
An extra recommended practice is to ensure that you paste your final chart as an image into your presentations. This can work wonders if you’ve been tasked with presenting your data repeatedly – enabling you to distribute consistent data while allowing you to continue using the same worksheet to update your figures in Excel. You’ll also no longer have to worry about recipients manipulating your charts later on.
A creative writer with a keen eye for SEO. Combining his love for the latest news with his expertise in search engine optimization, Petar delivers impactful content that resonates with readers.