Before we directly jump into the given topic, we should first understand the need or importance of project management. In all organizations, project management is needed at one time or the other to implement new undertakings. These undertakings may be diverse like the development of a new product or a service or establishing a new production line in a manufacturing enterprise. Organizations continuously face the challenge of the development of new products, processes, and services along with constant technological changes. In such a scenario, project management is a very important and powerful tool, which the organizations have to understand and implement.
Contents
Gantt Chart Technique

Source: ntaskmanager
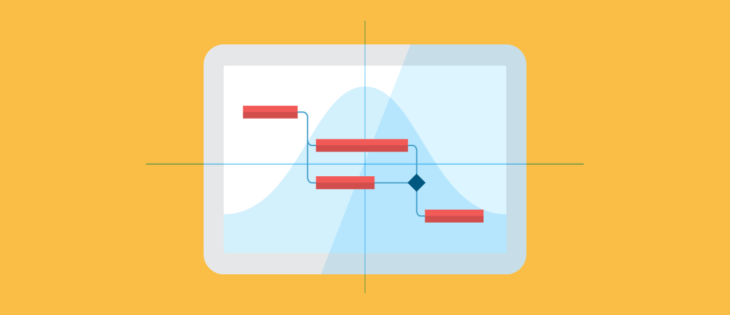
A Gantt chart is a charting technique, having wide applications in project management. These are basically used to present the schedules of each task involved in a specific project, as well as the current status or progress of each task. It is very useful to give the project manager a comprehensive picture of the entire project. He can understand more about the tasks which are yet to be completed. The order in which each of these tasks needs to be completed is also illustrated. This is of great help to the managers as they can get more organized with their management. Therefore, finding the best project management tool is key to the success of any project, no matter how big or small.
To create a Gantt Chart, you can use a simple tool like Gantt Chart Excel. Gantt Chart Excel is an excel based template and hence easy to use. You should be able to create a Gantt Chart in a few minutes.
History of the Gantt Chart
In the 1910s, Henry Gantt, an American social engineer, developed this technique of charting. Soon after, this technique went on to become immensely popular and many project managers from various fields started following what he started. The chart was consequently named after him and since then countless projects have benefitted from this technique.
The components of a Gantt Chart

Source: Shutterstock
A basic Gantt chart has two fundamental axes. The horizontal axis represents the time and the vertical axis represents the list of tasks. Depending upon the duration of the whole project, different units of time are used. Each task occupies a row in the vertical axis. A horizontal bar is placed adjacent to each row, usually to the right. This represents the task progress. The length and location of the Gantt chart correspond to the duration and the start/end dates of the task.
As Gantt charts are good for visualizing the entire project, the project managers are capable of doing the following:
- Track the tasks which are behind schedule and assess what are the things which need to be done in order to get the task back on the track.
- Organize the tasks according to the dependencies. Some of the tasks may be dependent on the completion of one or more than one other task. Thus, it becomes easy for the project managers to decide which task to do first, so that time and resources can be saved.
- The tasks which are behind schedule can be tracked and the authorities can also assess what needs to be done in order to get back on track.
Initially, when everything was handwritten, these charts had to be drawn on paper. This was definitely a great challenge, especially to the project managers who work with constant changes in their schedules. Whenever there was a major change, the whole chart had to be redone. This is not the case today as with the help of computers, it has become very easy to create, change and reproduce the Gantt charts. For more details check monday.com.
Benefits of using Gantt Charts
- Clarity: Gantt charts help in charting down multiple tasks and their schedules into a single document. Everyone will have a thorough understanding of the progress of the team.
- Communication: The Gantt charts can be used to take the place of meetings and various other status updates. The teams can get an easy and visually effective method to help the members.
- Motivation: the teams also get an external source of motivation as they can start focussing on the work at the front of the timelines.
- Creativity: Often due to lack of resources or time, project managers and teams are forced to adopt creative methods. Seeing the relationship between various individual tasks, Gantt charts can encourage new thoughts and procedures.
- Time management: Scheduling time is one of the most important benefits of Gantt charts. The teams will understand the overall impact of delays in a project, thus fostering stronger collaborations.
- Manageability: For project managers who handle complex assignments, Gantt charts are useful in externalizing the tasks. The managers can take more focussed and effective decisions about the resources.
